Chapter 3 Search

3.1 Selection & Search
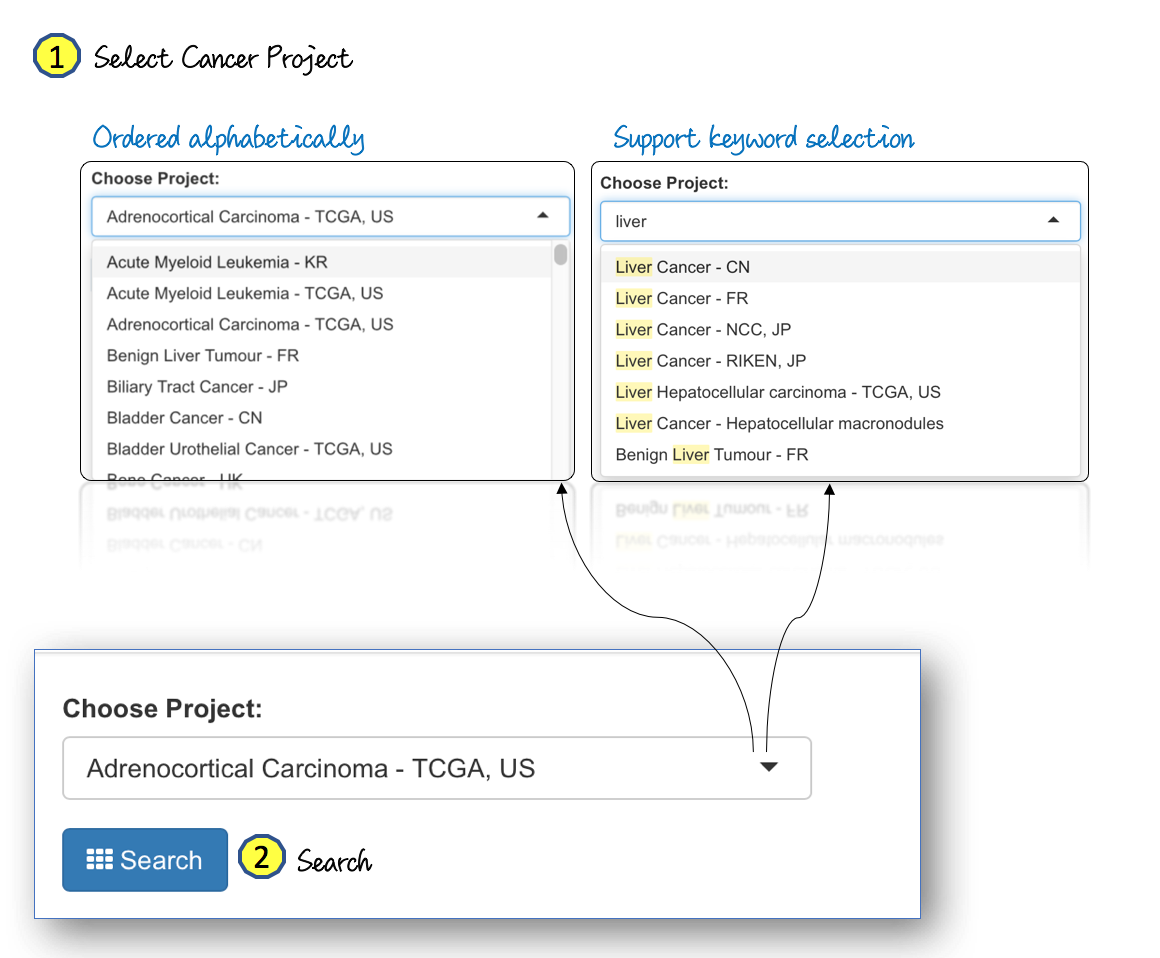
In the “Search” page, the somatic mutation frequency, classification of SNV substitutions, mutation spectrum, and landscape of mutational signatures of each TCGA/ICGA project are searchable through a drop-down list with 73 cancer projects. Cancer Projects in the drop-down list are ordered alphabetically and keyword selection is also supported.
3.2 Search Result
3.2.1 Summary of Project
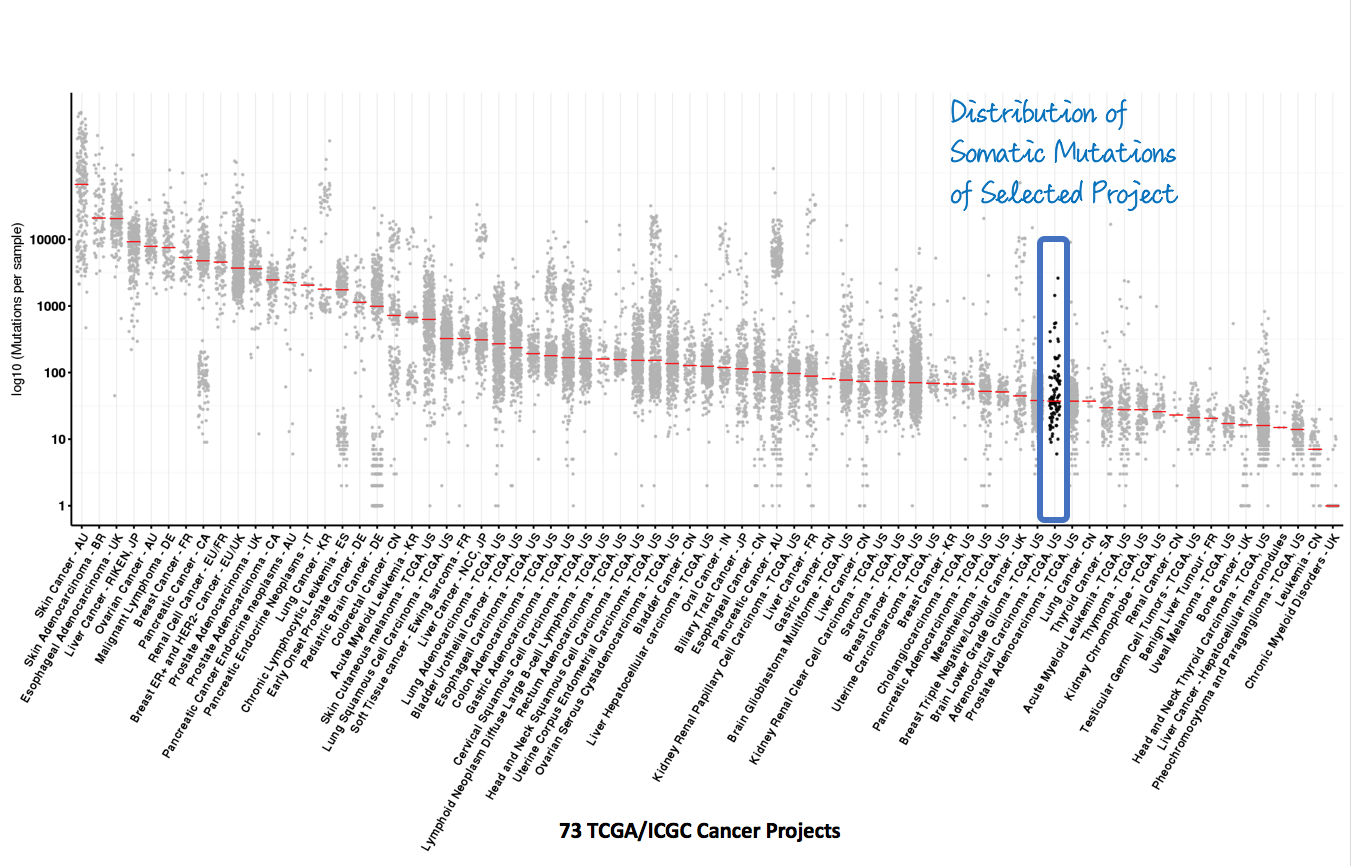
3.2.1.1 Number of Somatic Mutations Across Cancer Projects
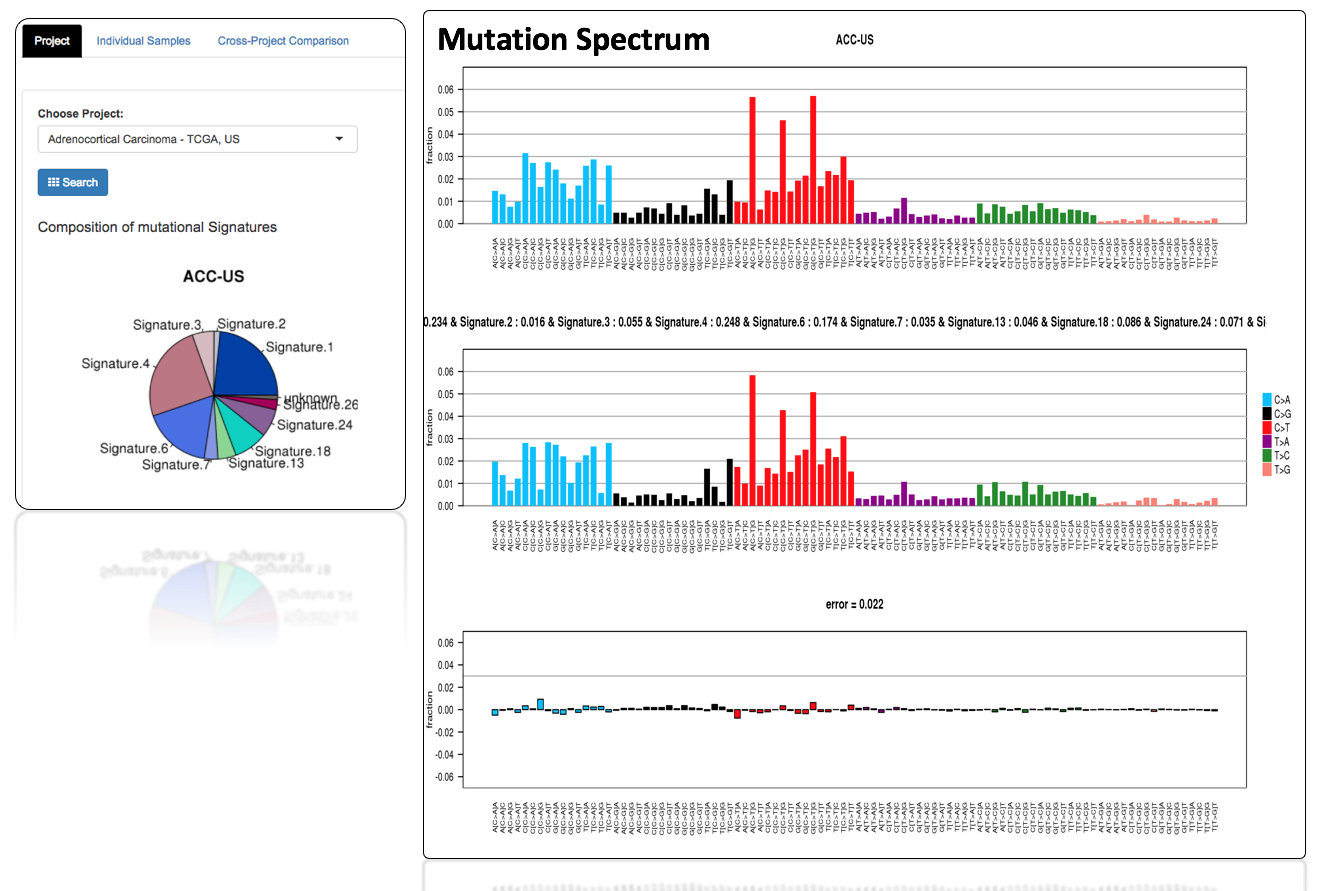
The selected project will be highlighted in a summary plot about the number of somatic mutations across cancer projects worldwide along with its mutation spectrum and composition of mutational signatures.
3.2.1.2 Mutational Spectra & Composition of Mutational Signatures
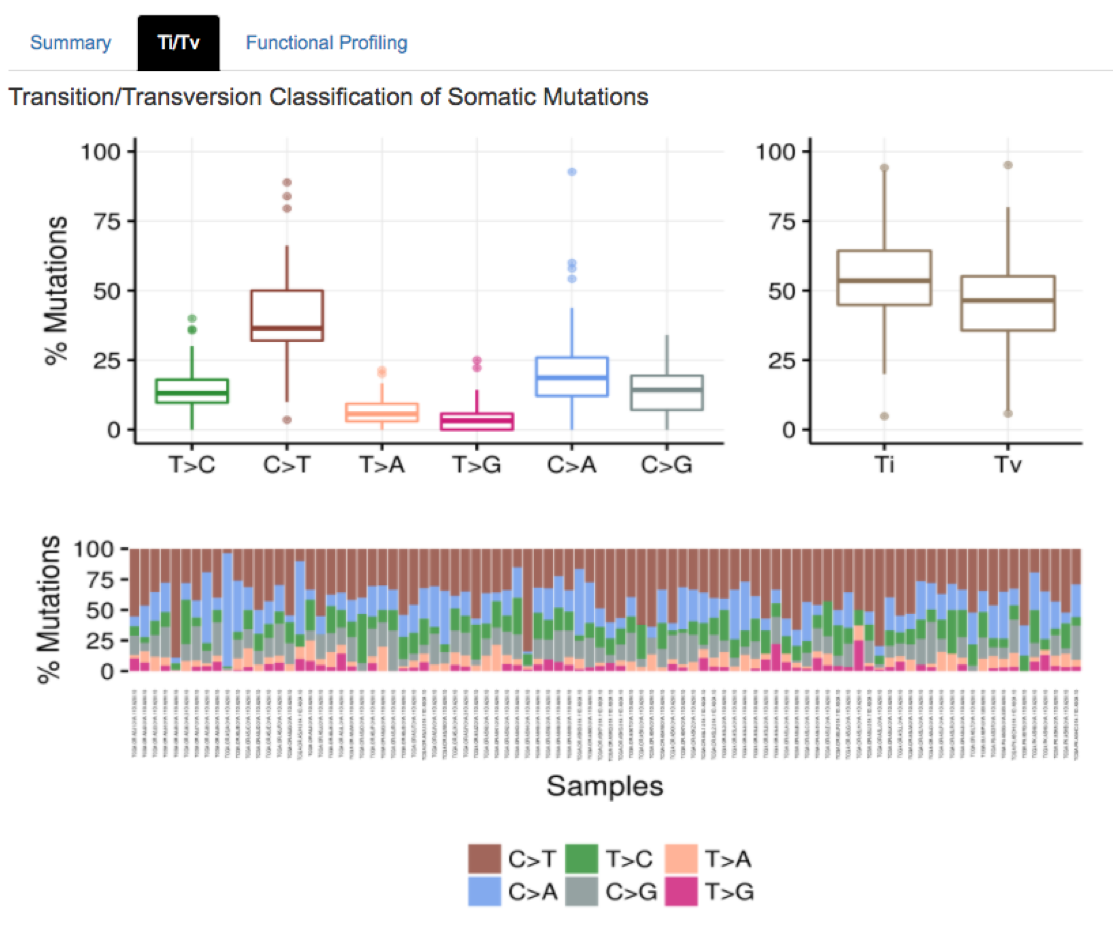
3.2.1.3 Transition/Transversion Classification of Somatic Mutations
The dominant mutation types within cancer project or across samples can be identified through transition/transversion classification of mutations.
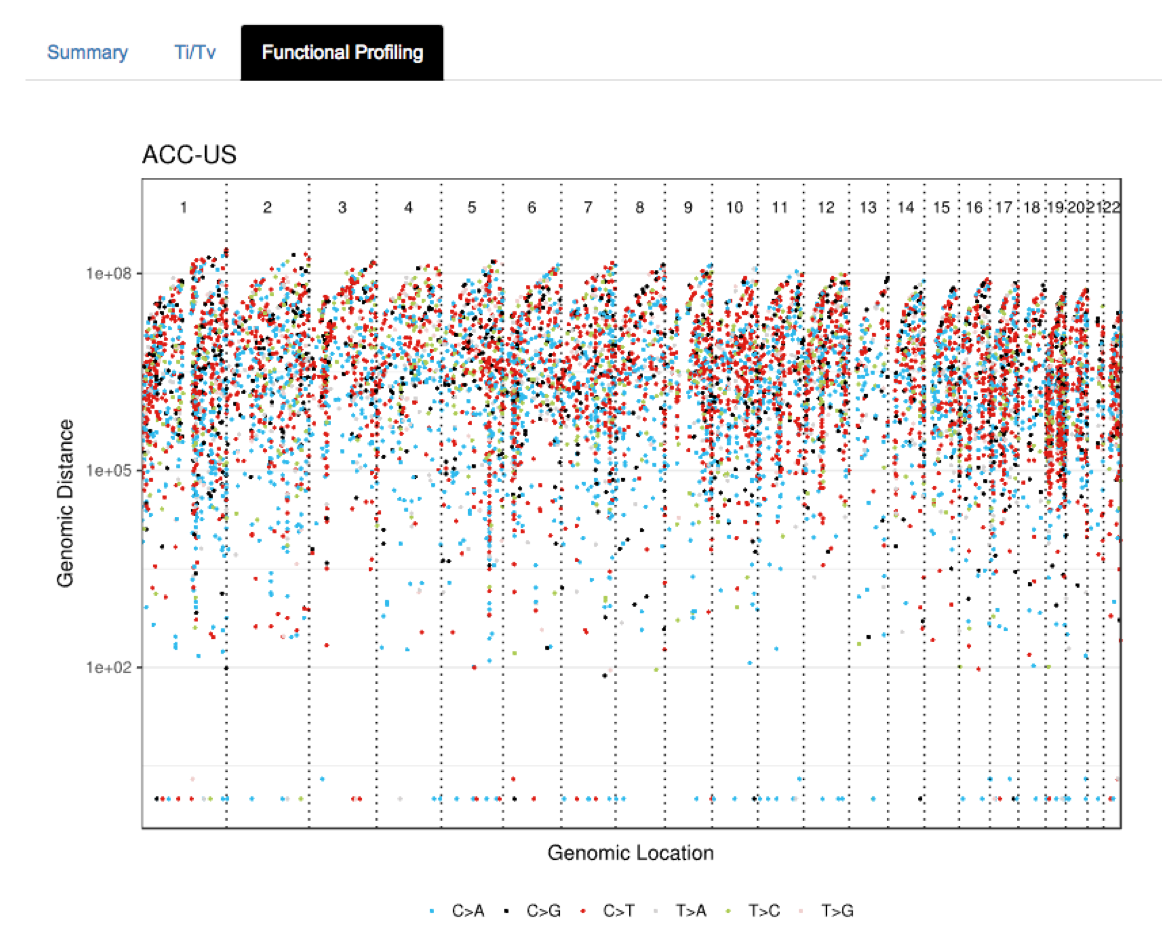
3.2.1.4 Rainfall plot
The rainfall plot is used to further identify localised clusters of hypermutation of each mutation type. The y-axis represents the distance between mutations, while the x-axis illustrates the genomic coordinates of the mutations. By displaying mutations according to substitution types and along a reference genome, users can easily depict dominant mutation types and localized regions of mutation hotspots
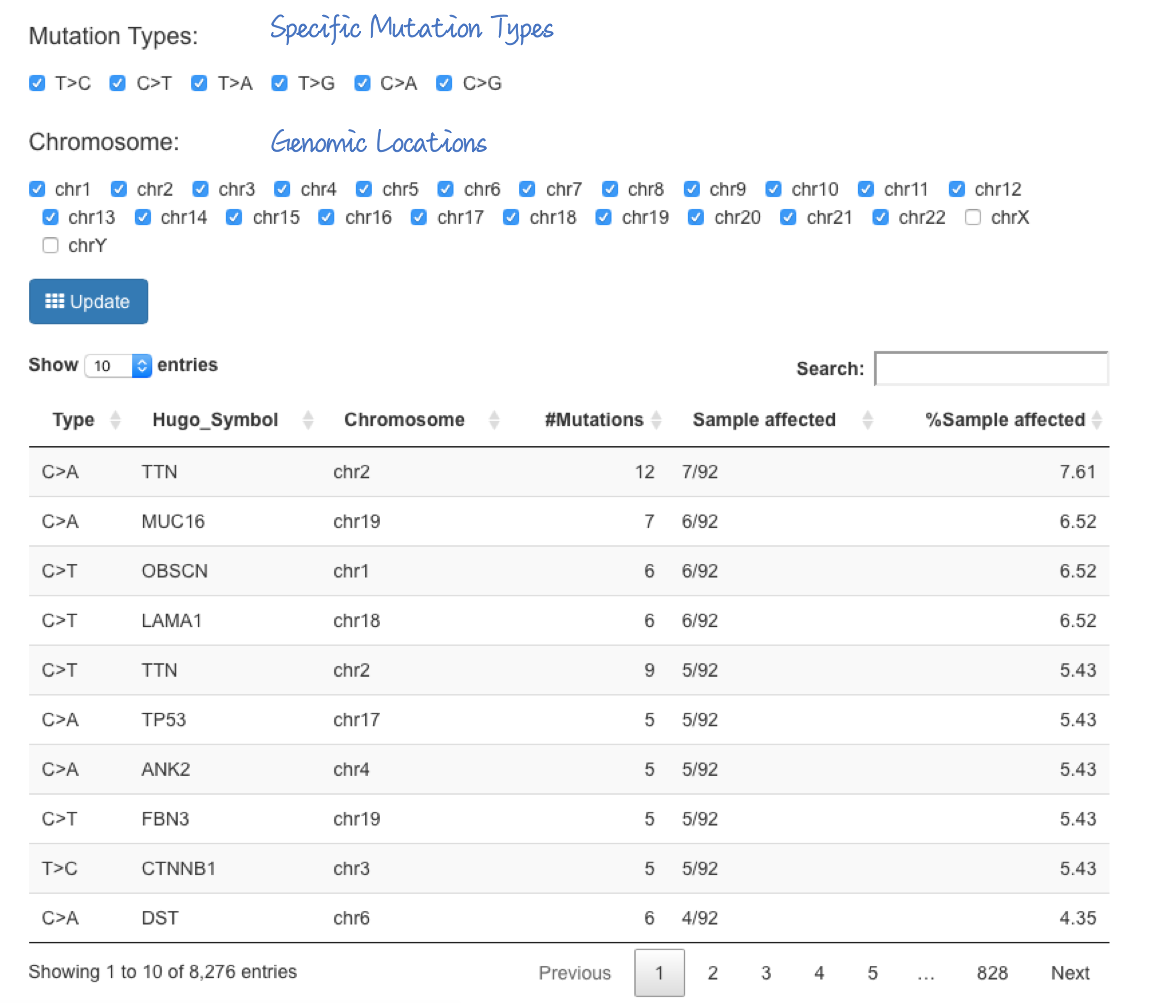
3.2.1.5 Functional Profiling of mutated genes
As shown in the figure below, users can focus on specific mutation type (e.g., C>T or C>G) or genomic location (e.g., chr1~22) through the checkboxs provided by mSignatureDB. Detailed information about mutation types and their respective genes, number of mutations, and percentage of affected samples are provided as a HTML table.
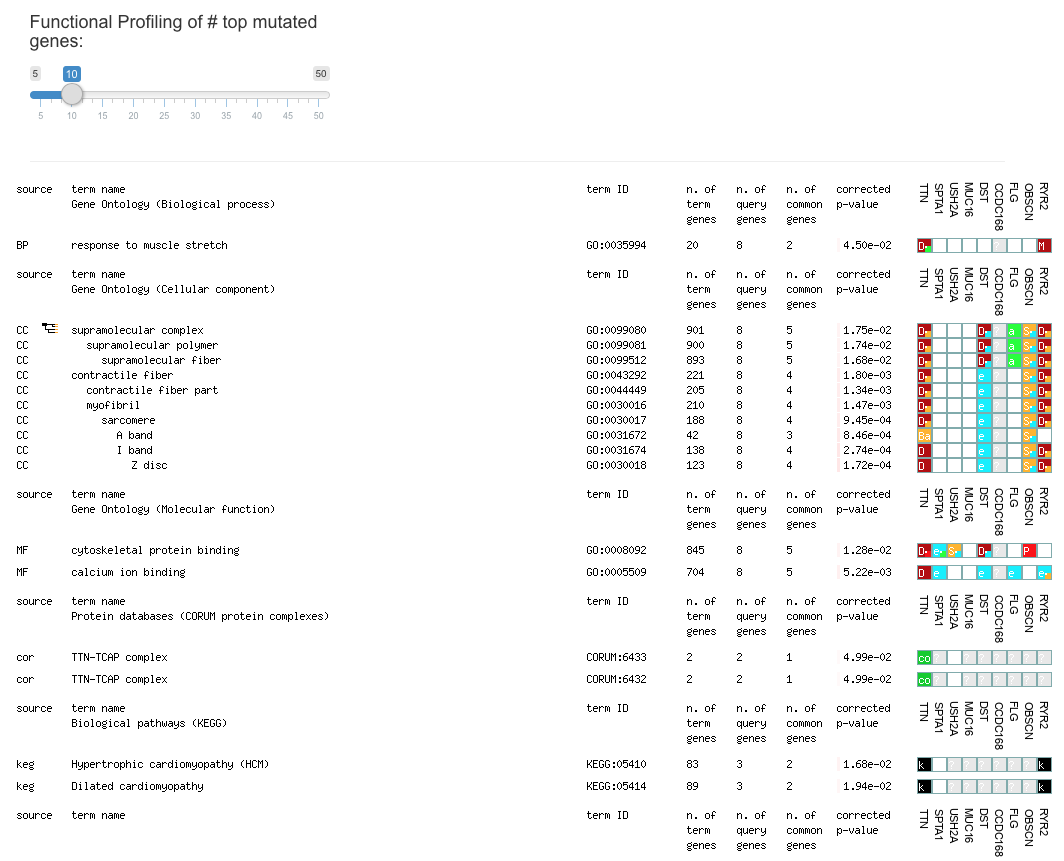
Furthermore, functional profiling of the most frequently mutated genes can be performed according to each substitution type to facilitate the users to identify their target of interests or potential therapeutic targets.
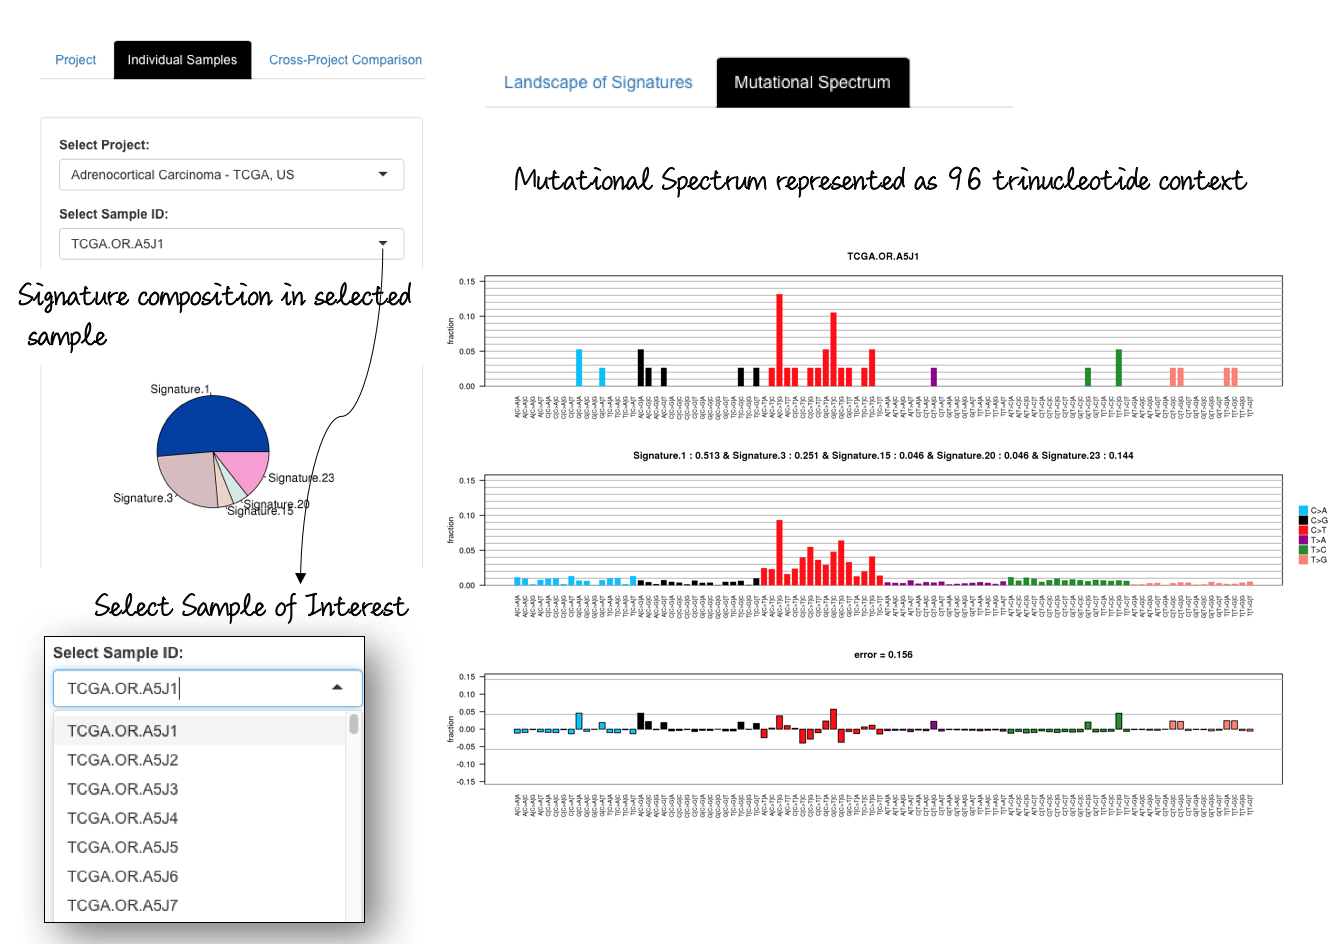
3.2.2 Inspecting signature composition at sample resolution
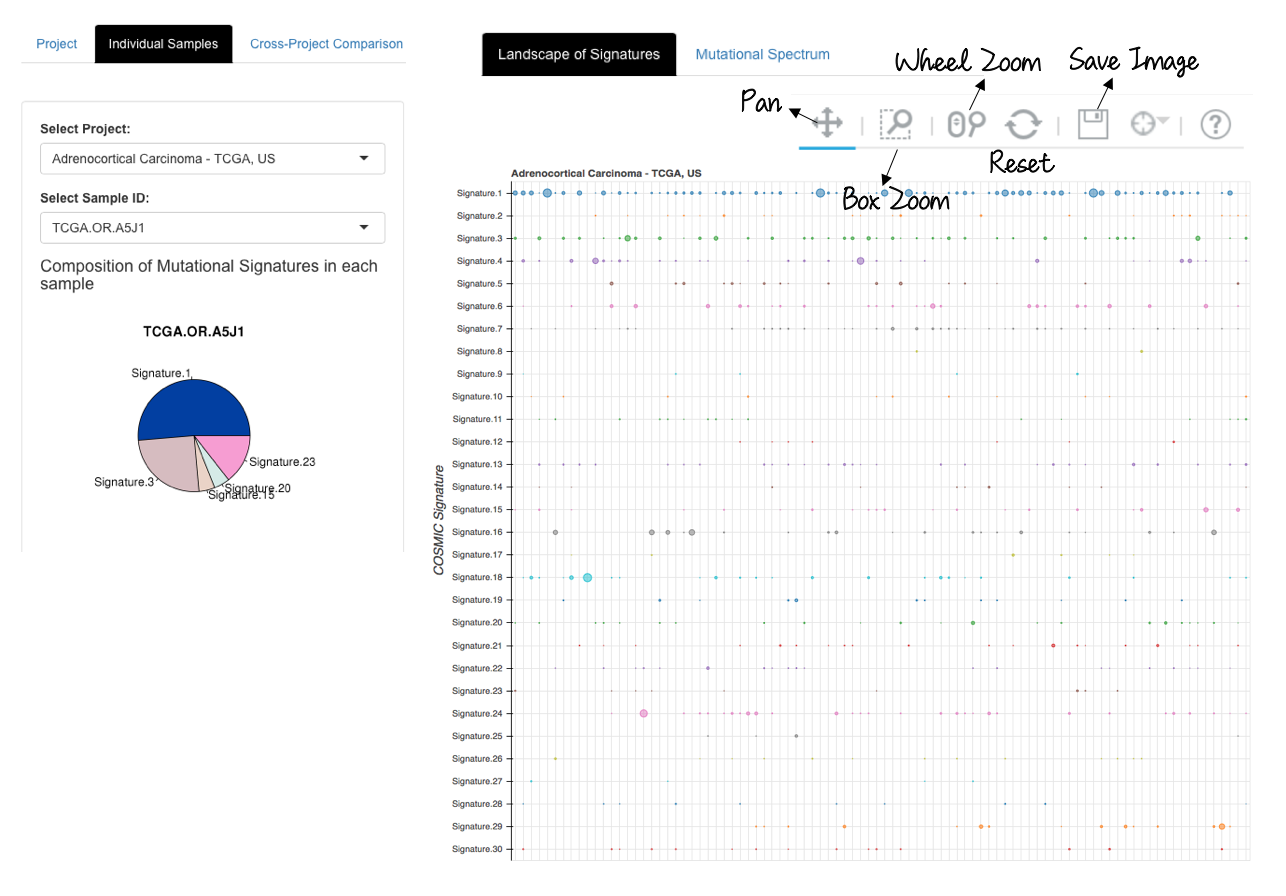
User-friendly control elements such as Pan, Box Zoom, Wheel Zoom, Reset and Save Image are available for the creation and manipulation of landscape maps of mutational signatures.
3.2.3 Cross-Project Comparison
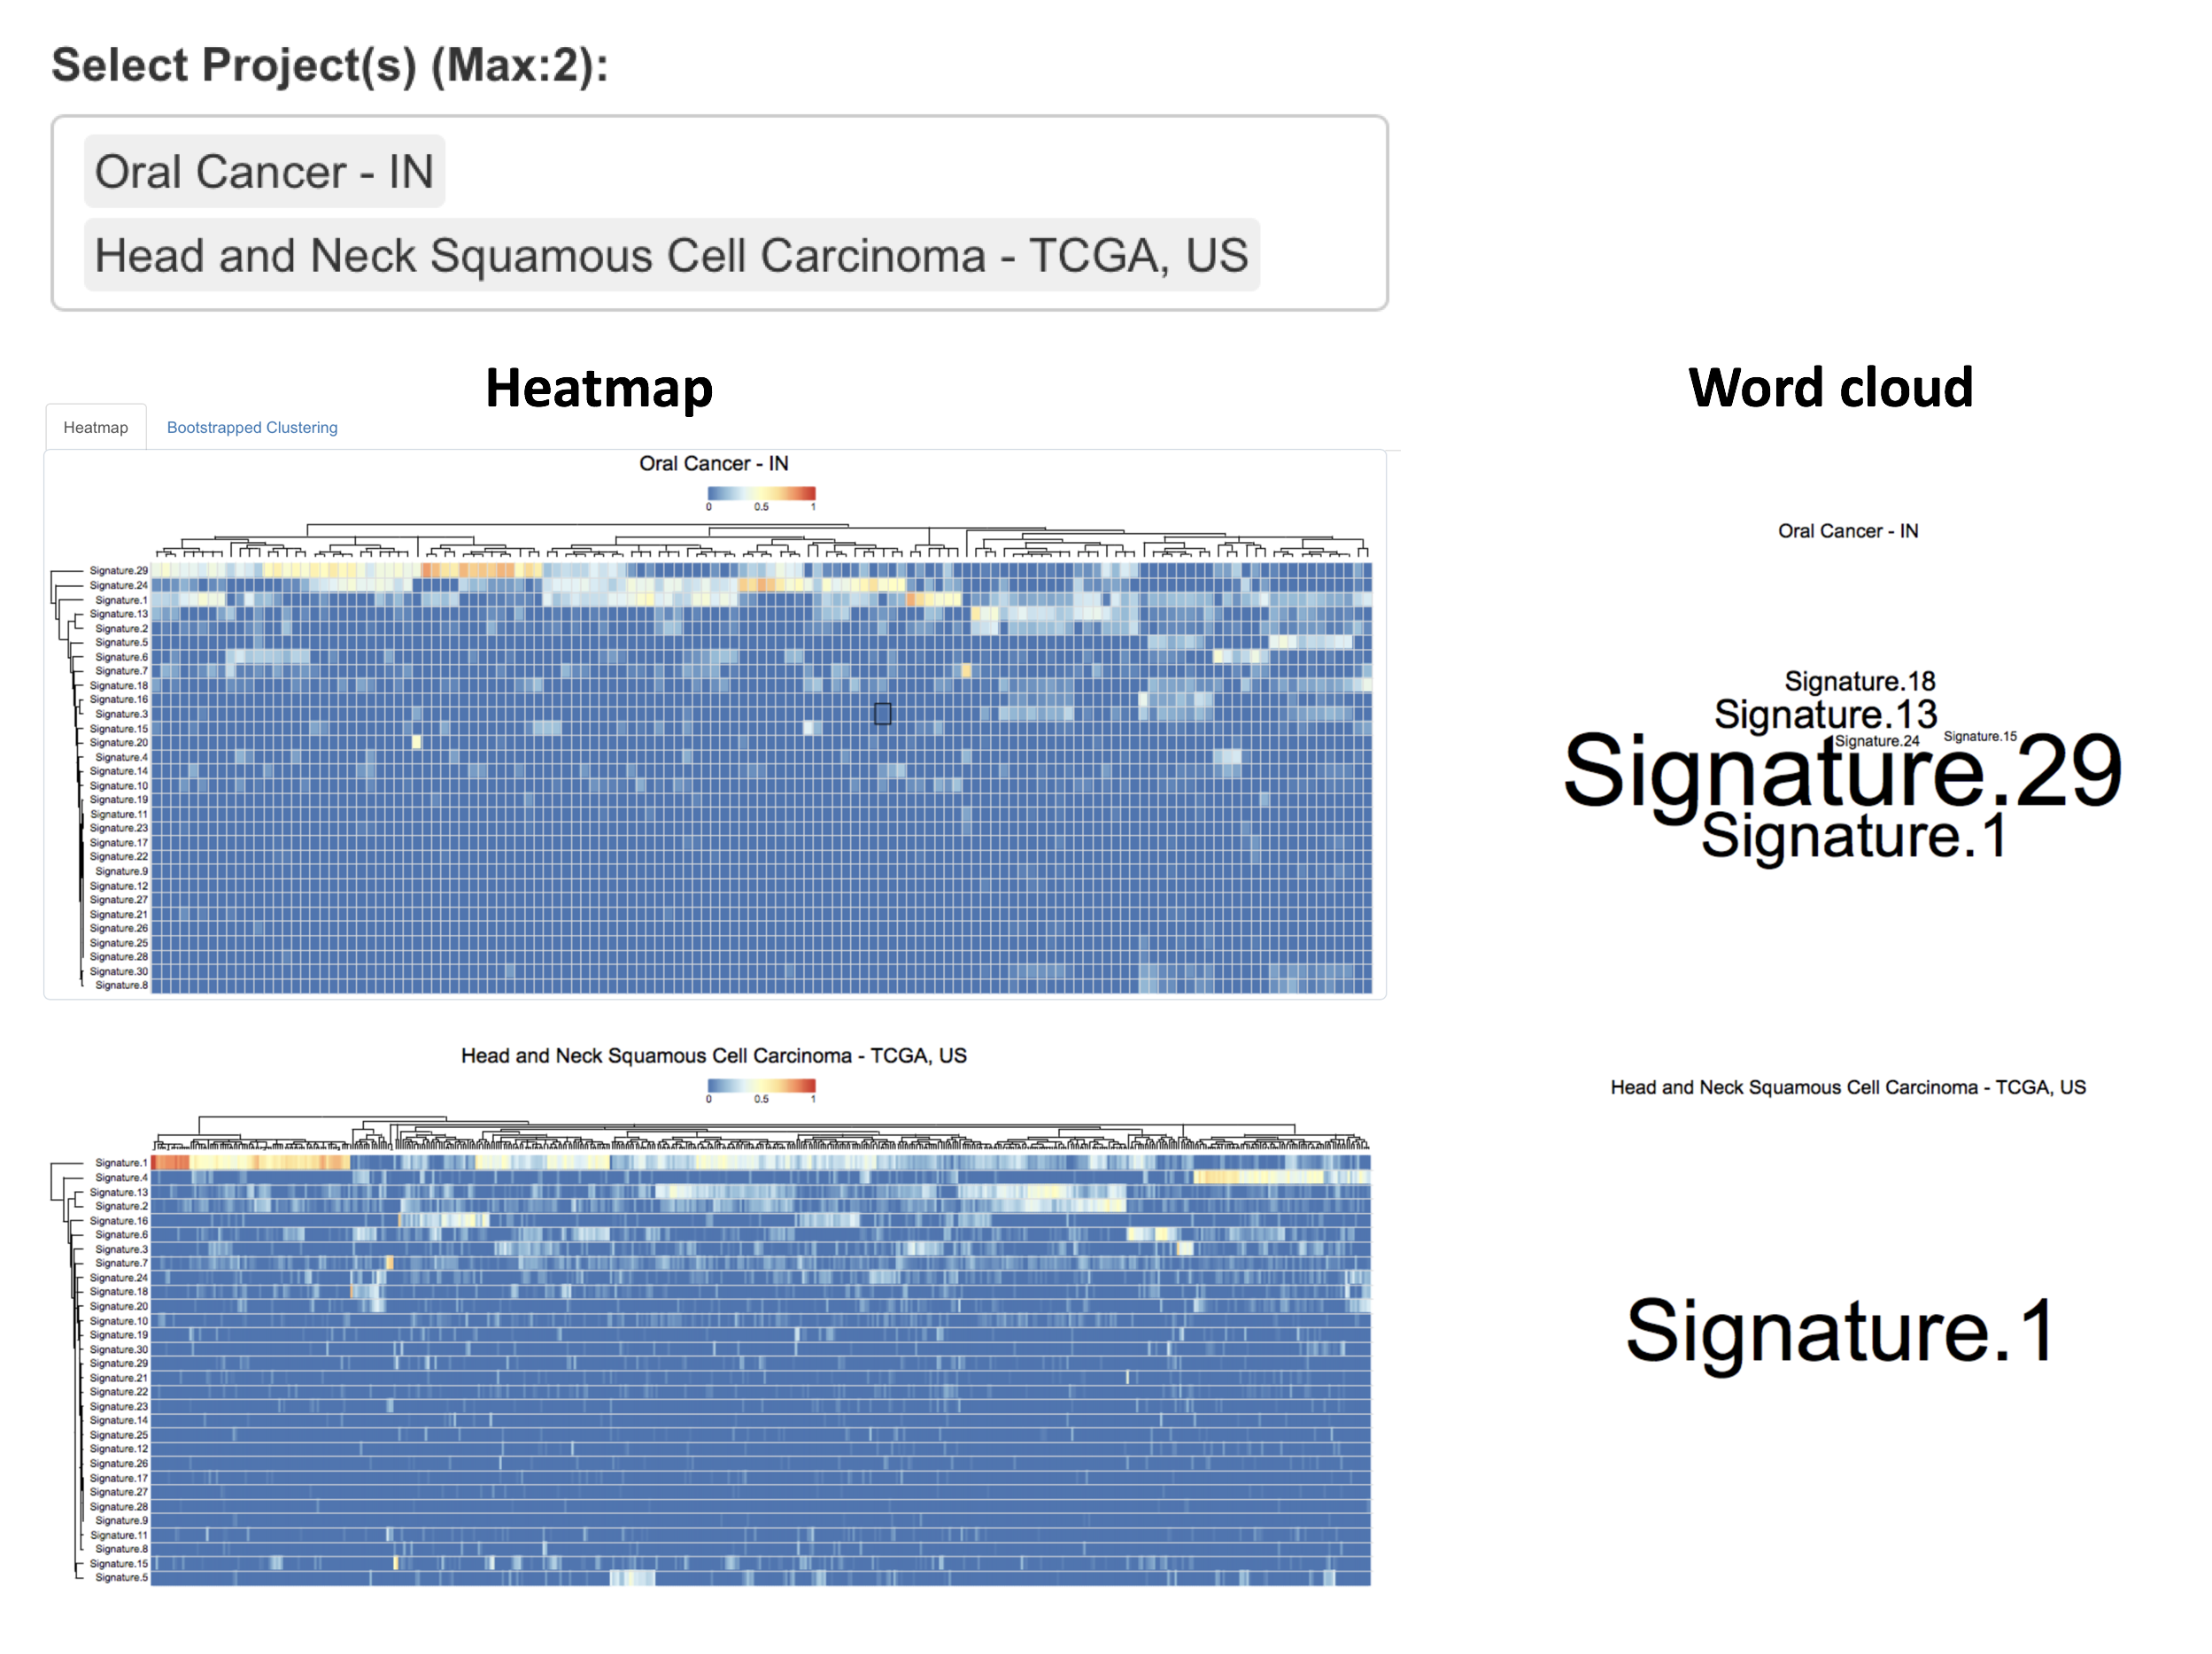
3.2.3.1 Heatmap
3.2.3.2 Heatmap (Additional function for data filtering)
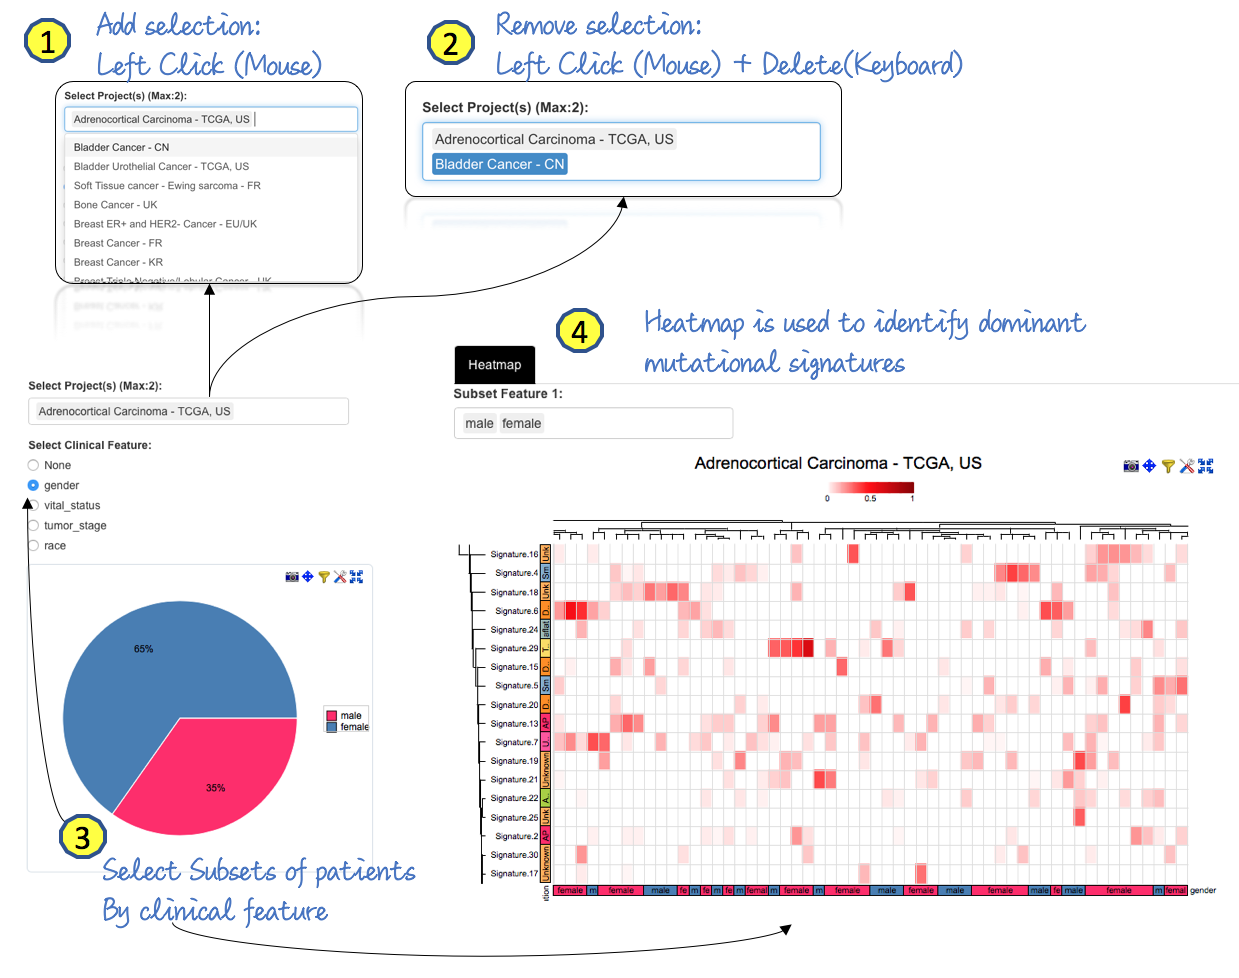
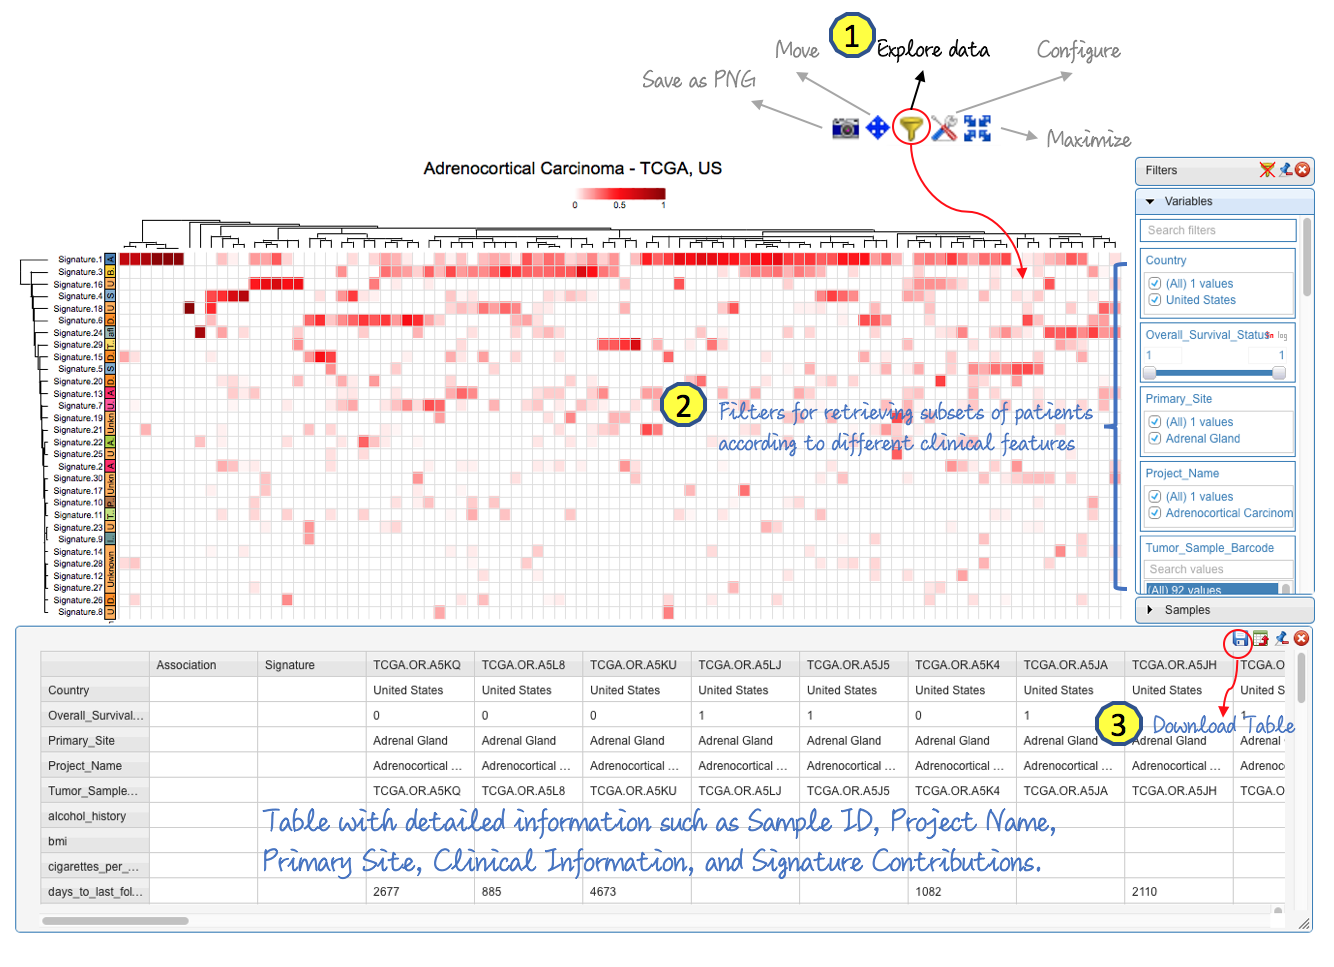
Users are able to select subsets of patients and compute statistically significant differences in signatures between clinical categories (e.g., sex, gender, vital status and tumor stage) on the fly with the aid of canvasXpress package
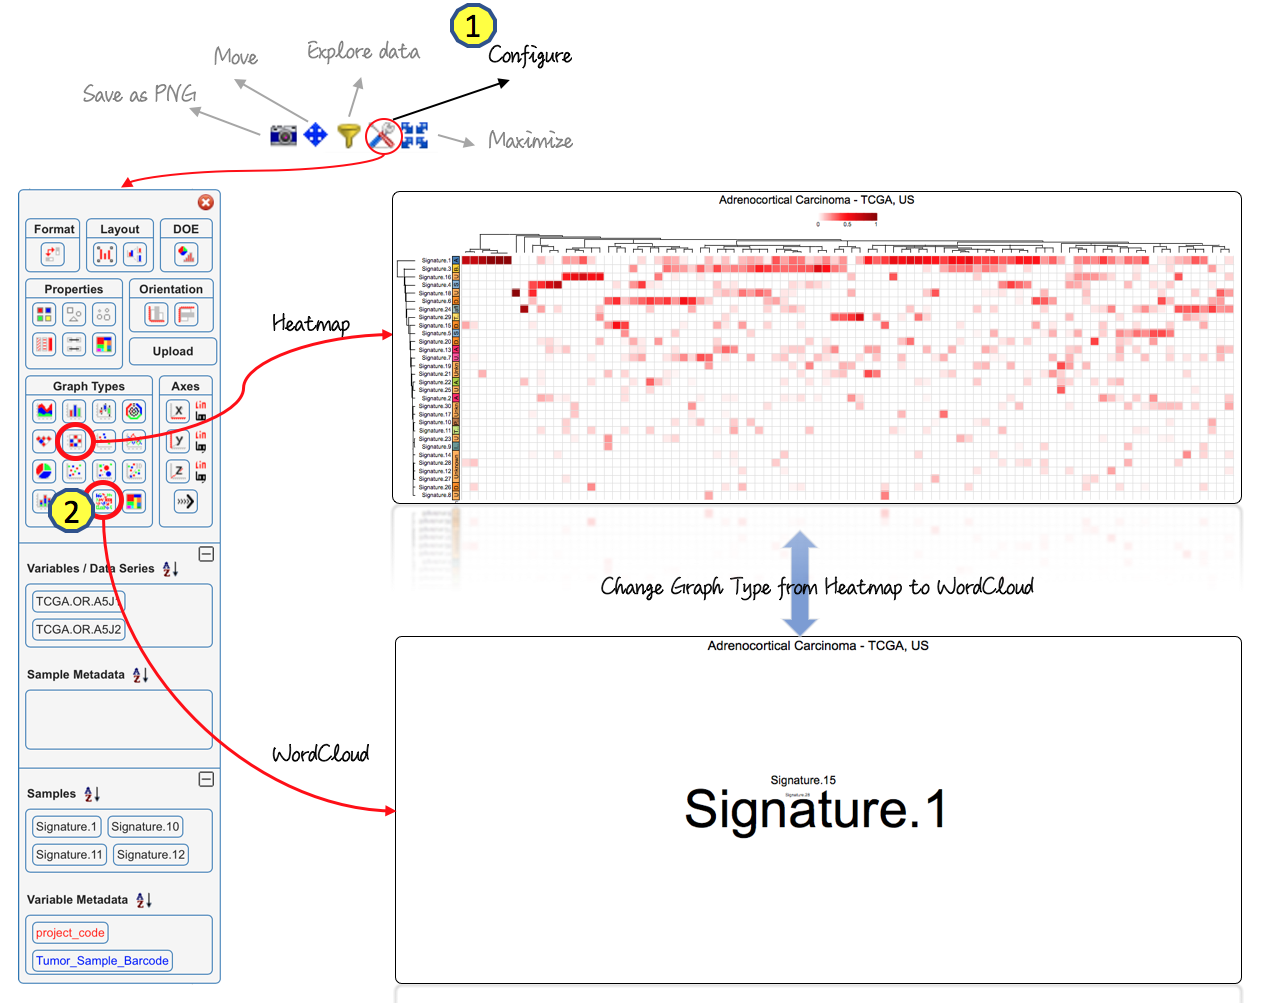
3.2.3.3 Heatmap (Change Graph Types)
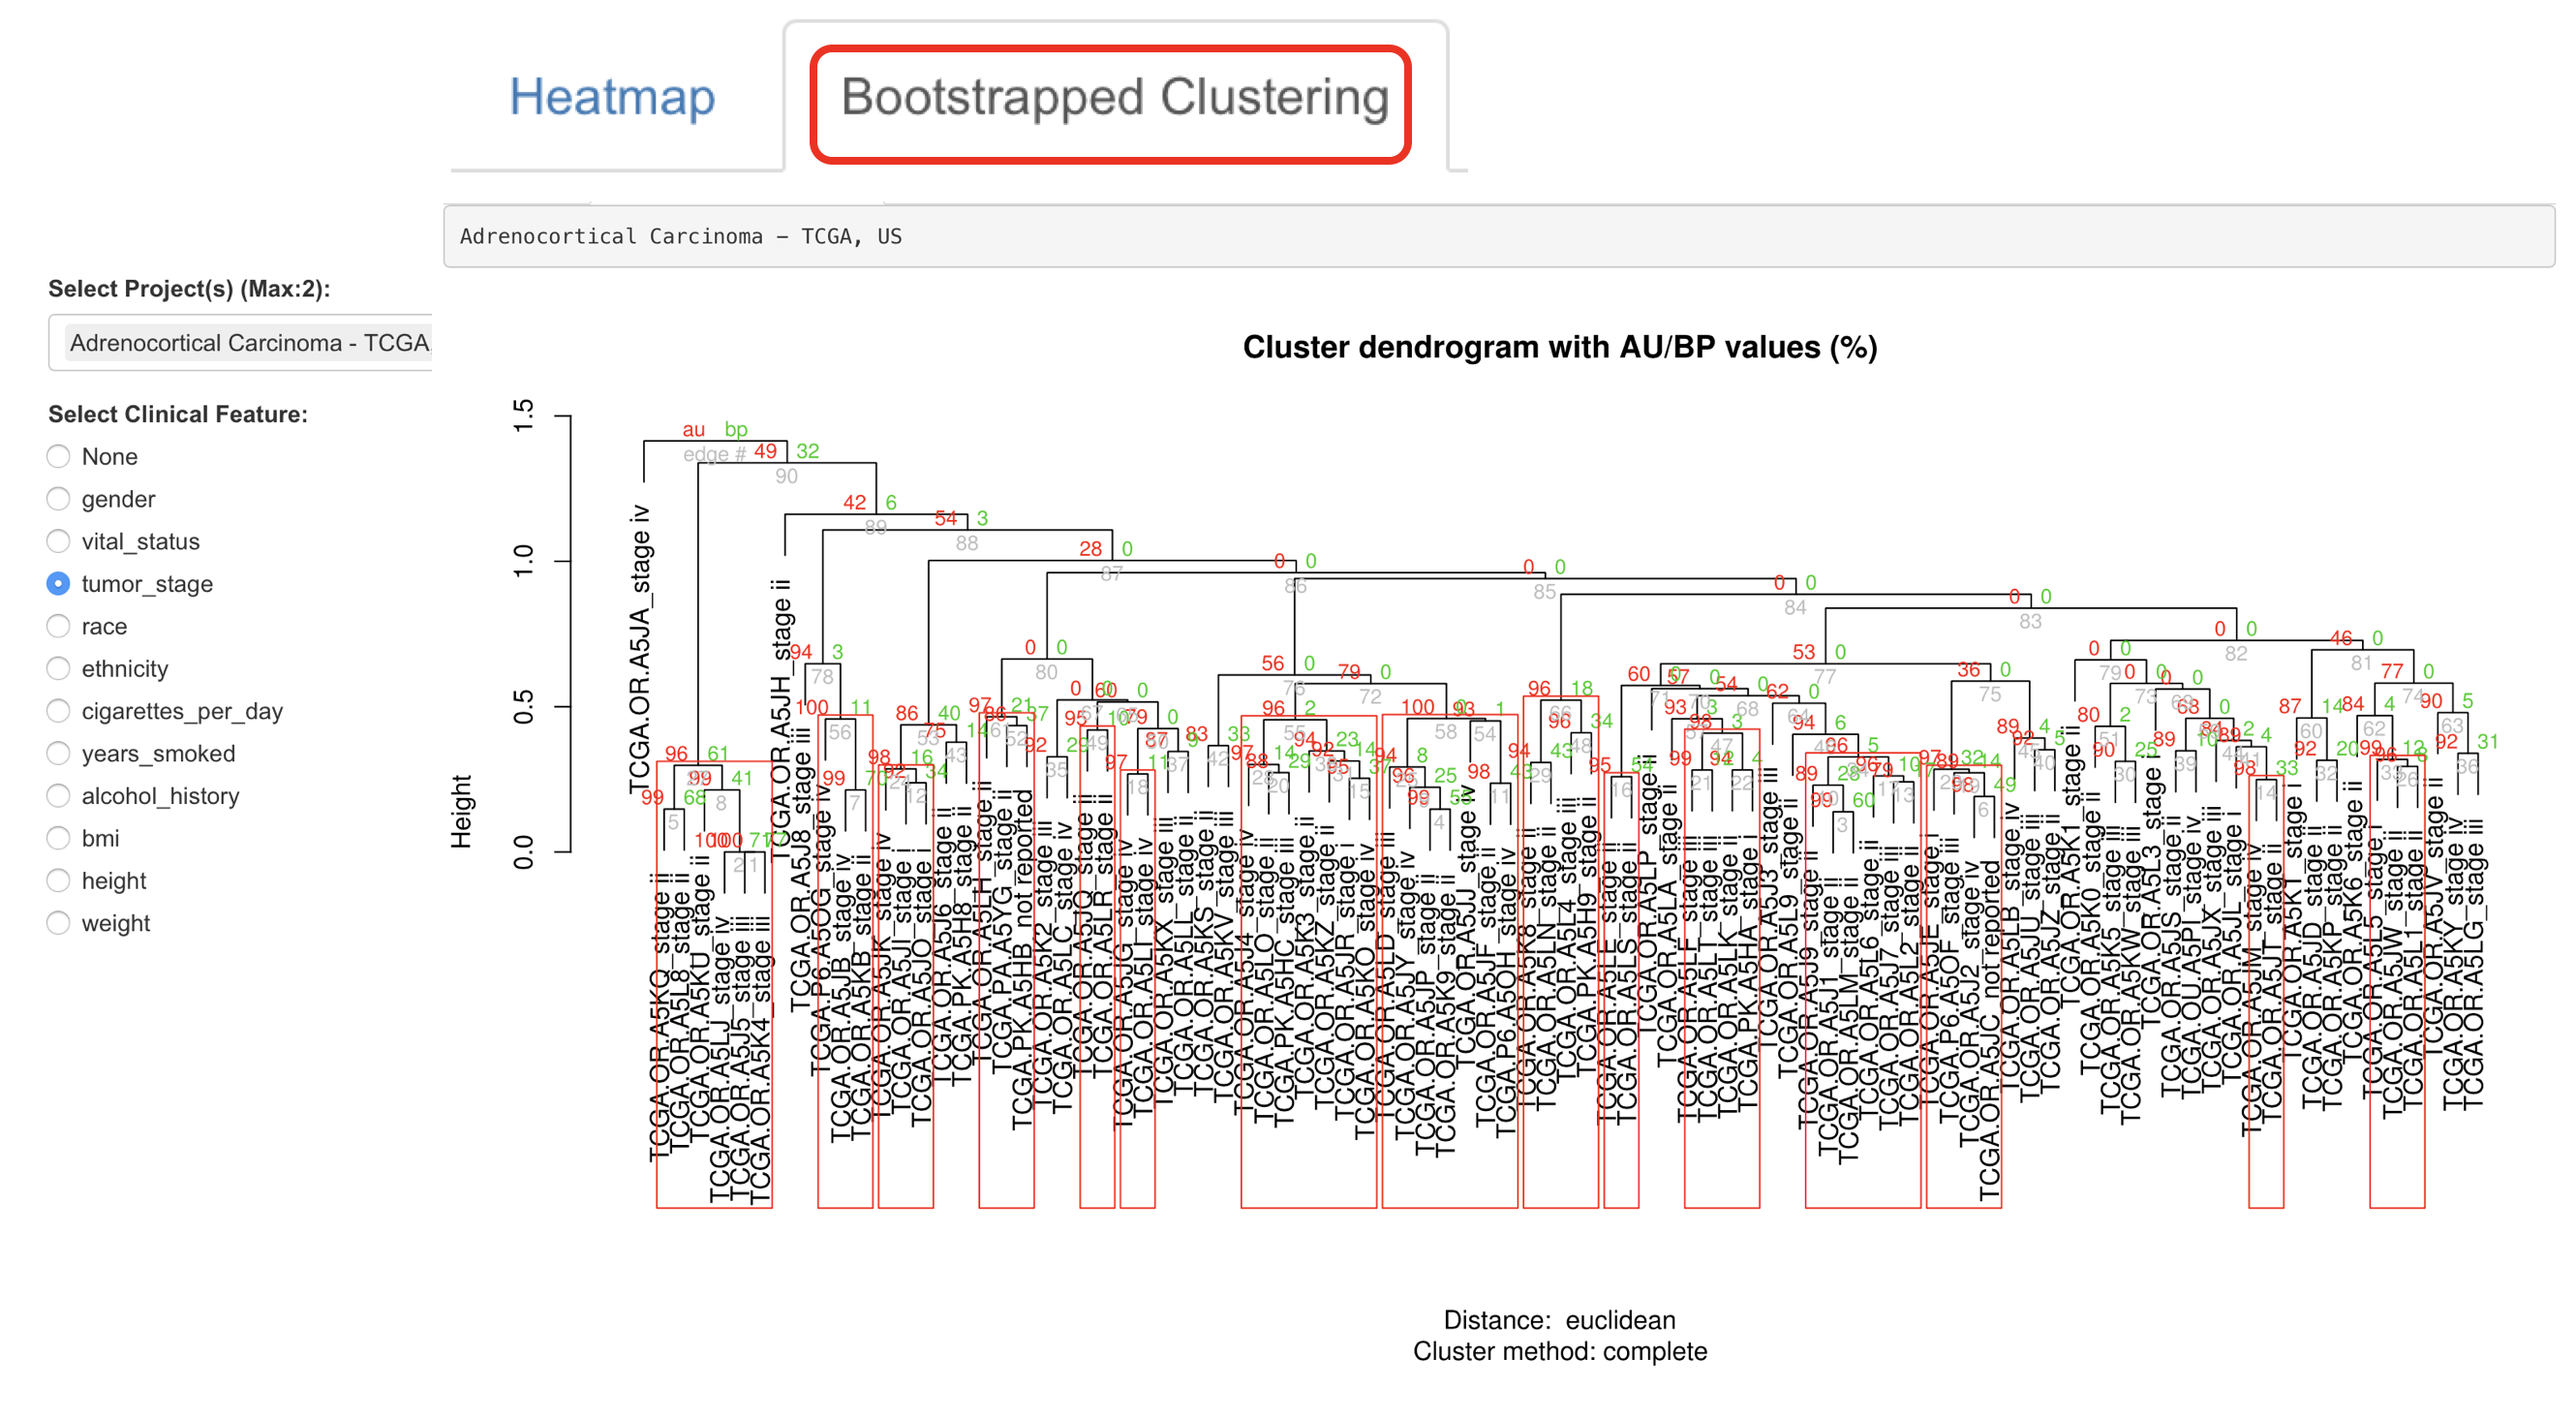
3.2.3.4 Bootstrapped Clustering
3.2.3.5 Pair-wise comparison between 2 cancer projects
